
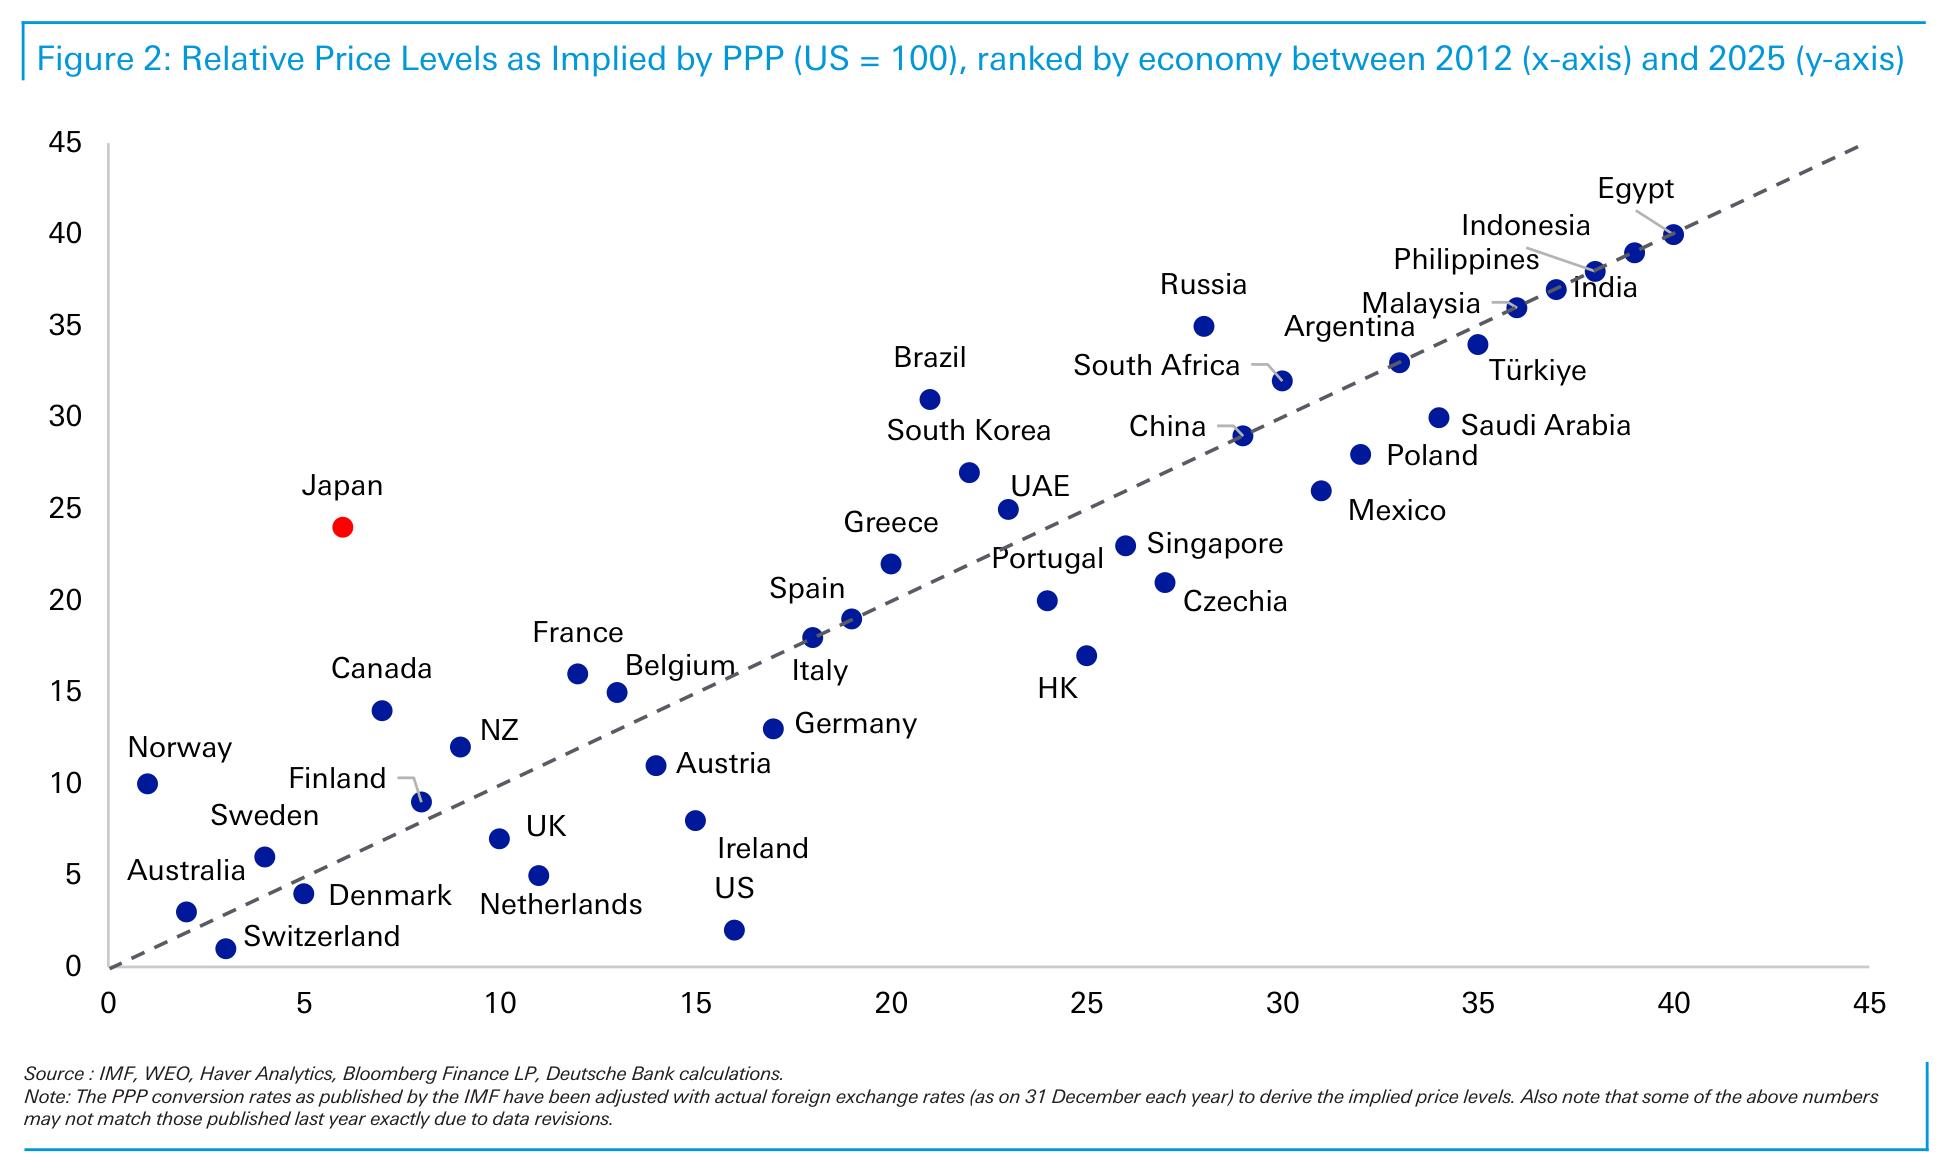
trades due to ultra-low rates, money flowed back to Japan as other global central banks also slashed rates close to zero (like Japan had previously for years). The Yen uncertainty about the US post the GFC. Nearly a decade and a half later and Japan and the Yen has become the premier funding currency of the world again. Given Japanese inflation has been relatively low globally, while its currency has slumped, Japan now stands out amongst its developed market peers in this report as being extremely cheap when converting to USDs. The yen is down by-51% since 2012 and inflation is 'only' up by +20%. The result is a Tokyo that is now genuinely



 原图定位
原图定位